
The ServicePRO® Data Analysis module contains a comprehensive suite of reporting features. You can choose from a broad selection of standard reports, or use a standard report as a template for creating one of many types of custom reports.
Data analysis is enhanced by the powerful ServicePRO® Chart Designer, which gives you all the the tools you need to easily create and distribute customized graphical information.
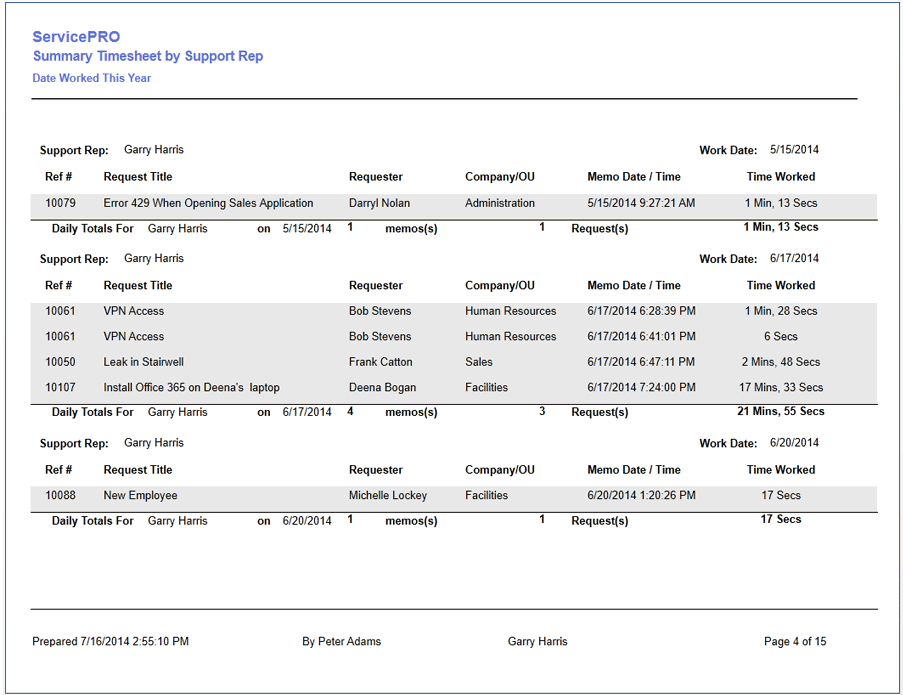
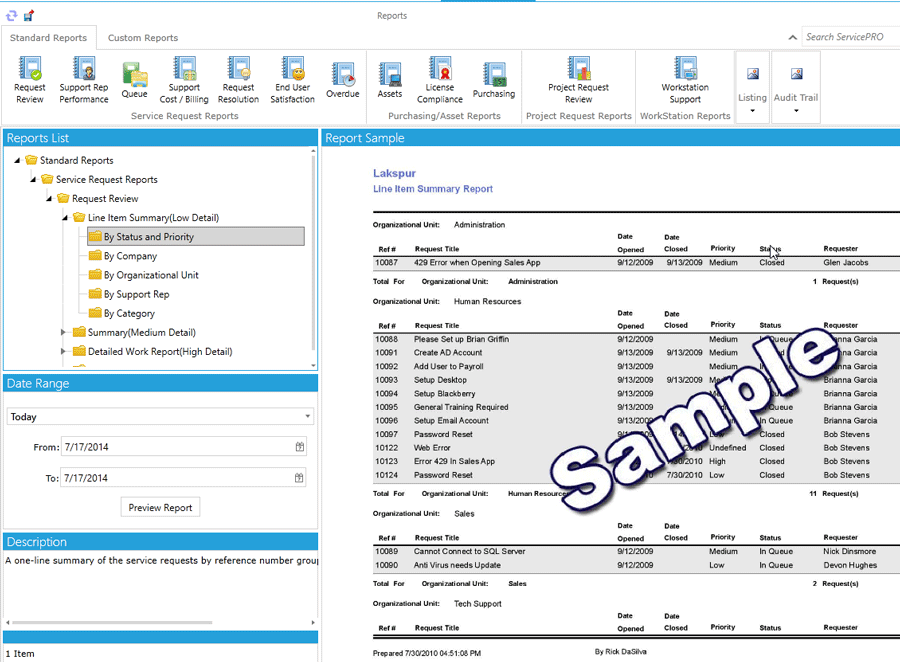
The ServicePRO® Data Analysis module contains a large array of standard reports which are easy to customize and filter to meet your specific needs. With just a few mouse clicks, you can quickly access business process and IT performance information in either summary or detail form.
Each type of report offers a set of nodes on the report tree for viewing information in various formats—including low, medium, and high detail.
Service Request Reports
Purchasing/Asset Reports
Project Request Reports
Workstation Reports
Listing Reports
Audit Trail
Asset Reports
And many others
Instantly specify how you want to group your reports:
Service Request Reports
Purchasing/Asset Reports
Project Request Reports
Workstation Reports
Support Rep
Category
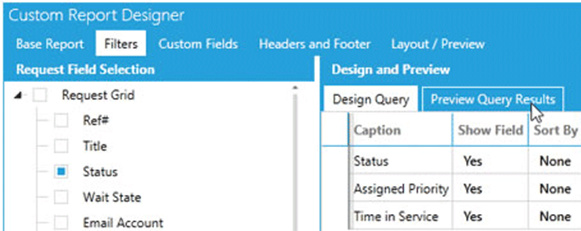
The ServicePRO® Custom Report Designer makes it quick and easy to specify precise data types and fields. Grouping levels, header/footer, and general report layout are seamlessly integrated through the intuitive user interface.
Many prebuilt design templates are included for several business process categories including purchasing, project management, and asset management to name just a few.
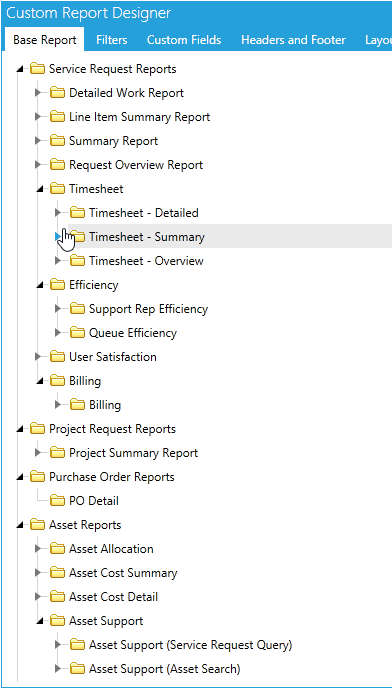
Each template is built on an intuitive framework designed to shorten learning curves and enhance productivity This framework provides users with instant access to:
Service Request Reports
Purchasing/Asset Reports
Grouping
Headers and Footers
The Layout / Preview tab provides instant visual feedback to the user, enhancing the customization process.
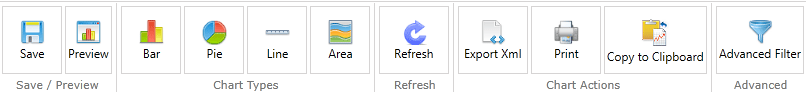
ServicePRO® includes powerful and intuitive tools designed to create engaging and informative charts. The visual Chart Designer allows users to quickly specify data fields and groups, filters, along with many other parameters. Several chart types are available including Bar, Pie, Line, and Area.
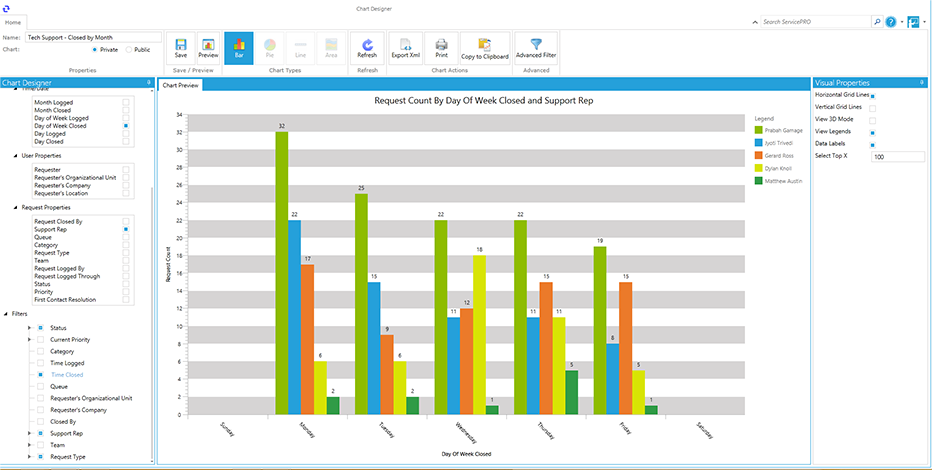
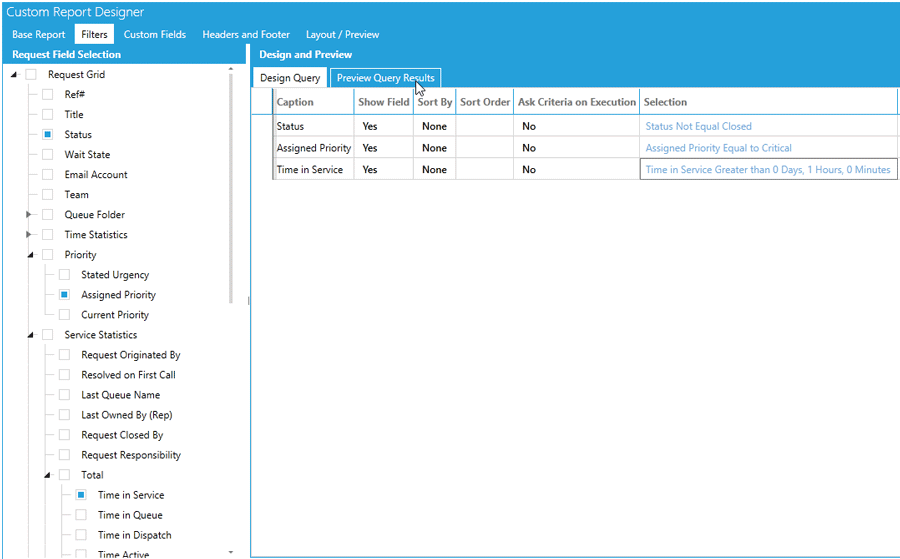
Advanced filtering simplifies the process of transforming raw data into actionable information presented in powerful graphs and charts. And custom reports can be easily exported to many popular file types including XML and CSV.
The ServicePRO® Query Designer allows quick and flexible data analysis in tabular format. As with all ServicePRO® reporting, filters and constraints are easily implemented in queries allowing users to obtain precise information.
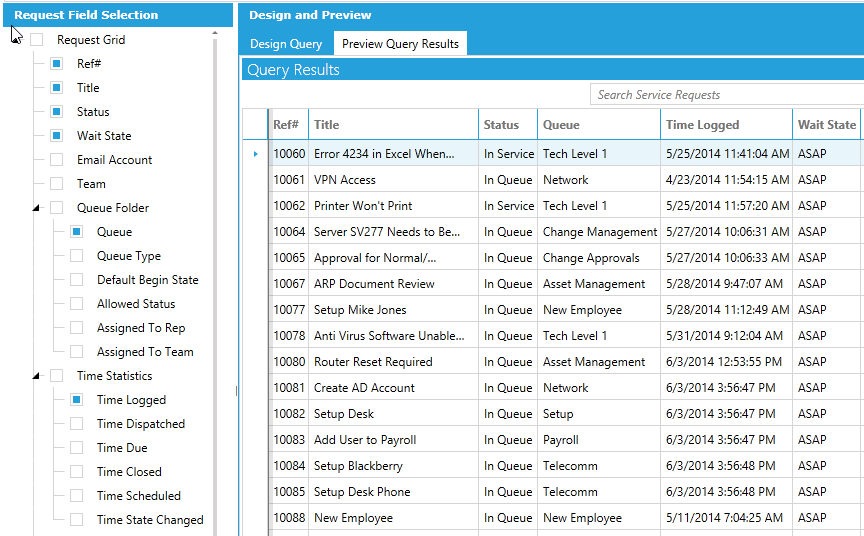
Queries are easily monitored for changes over time. And query results are always ready for export and distribution in all popular file formats.
ServicePRO® Workload Reports allow managers to quickly understand both summary and detailed information about Service Request status across their area of responsibility. Workload Reports are available at the individual, team, and departmental level.